
How to view and search your request logs
Inspect every API request on the Logs page — filter by date, key, type or status, read usage charts, and export to CSV or JSON

Written by Brian Hollis
June 28, 2026
Updated July 21, 2026
How to view and search your request logs
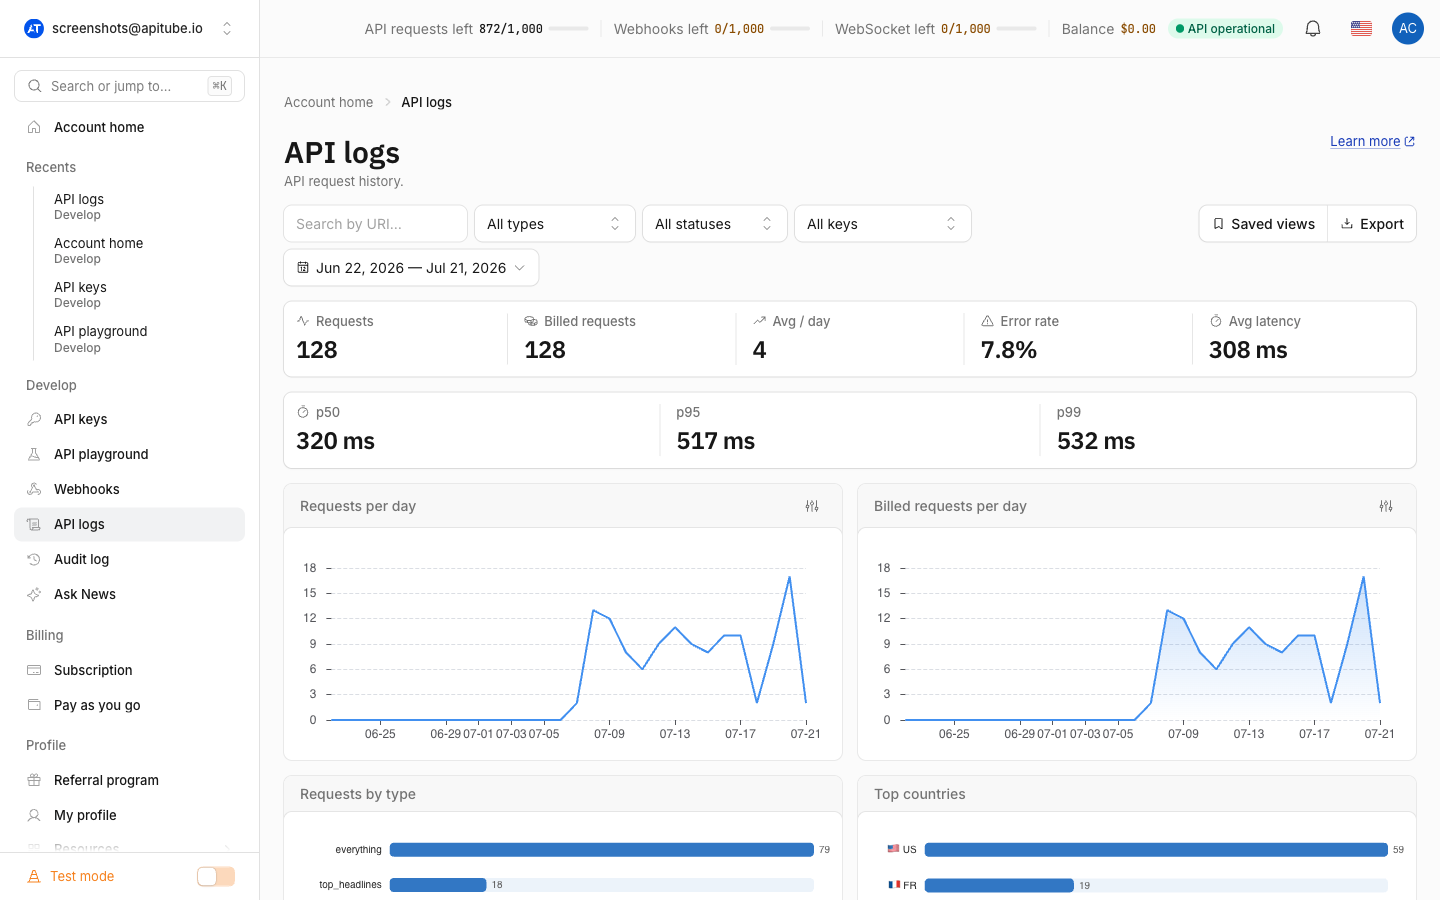
Open the Logs page in your APITube dashboard to see every API request your account has made. The page shows a searchable, filterable table — one row per request with its time, endpoint, request type, status code, latency, key and cost — plus usage charts above it. You can narrow the list by date range, API key, request type, status, or a full-text search, and export the filtered view to CSV or JSON.
The Logs page is the fastest way to answer “what did my integration actually call, and what came back?” — useful for debugging a failing request, confirming a key is live, or auditing which key spent what.
Where do you find your request logs?
Go to Logs in the dashboard. Every request is recorded with its timestamp, the endpoint it hit, the HTTP status it returned, its latency, the key that made it, and the cost it spent. Two scopes apply automatically:
- Workspace. You only see requests made with keys that belong to your current workspace, so switching workspaces switches the log you are looking at.
- Test vs Live mode. The table follows the dashboard’s mode toggle: in Test mode you see Test-key traffic, in Live mode you see Live-key traffic. Switch the mode to see the other set.
Each key’s own per-key view of this data — lifetime usage, last-used time and a usage chart — lives on the key’s detail page; see how to view usage for each API key for that angle.
What does each log row show?
The table has a column for each part of a request:
- Time — when the request arrived.
- Type — the request type, the same endpoint-family name used by endpoint scopes (
everything,top_headlines,article, and so on). - Status — the HTTP status code, shown green for success and red for
400+ errors. - Latency — how long the request took, in milliseconds.
- Key — which API key made the call.
- Cost — what the request spent.
- Endpoint — the request path.
Click any row to open a detail panel with more: the result count, the caller’s IP and country, the full request URL and its parameters, a Copy as cURL button, and an Open in Playground link when the endpoint is reproducible there. Your API key is masked everywhere in this panel — in the URL and in the parameters — so sharing a screenshot never leaks the secret. Some rows may have no status if the request was not fully logged.
How do you filter and search the logs?
The toolbar above the table holds the filters, and they combine — apply several at once to zero in on a request:
- Search box — full-text match against the request; press
/anywhere on the page to jump into it. - Type — pick one request type; the dropdown shows each type with how many requests match.
- Status — All, Success, or Error.
- Key — limit to one API key (each option shows its request count).
- Date range — pick the period with the date picker.
Filters are reflected in the page URL (from, to, type, status, key, q), so a filtered view is a shareable, bookmarkable link — for example /logs?key=12&status=error jumps straight to failed requests from key 12. You can also save a filter combination as a saved view to reuse it later.
How do you read the usage charts above the table?
Above the table the page summarizes the filtered requests so you do not have to scan rows by hand. A stat strip shows total requests, total cost, average per day, error rate, and average latency, with p50 / p95 / p99 latency percentiles beside it. Charts then break the same data down: requests per day, cost per day, a split by request type, top countries, a status breakdown (2xx / 4xx / 5xx), and your top error endpoints. Every chart respects the active filters, so filtering to one key or one day reshapes the charts too.
How do you export your logs?
Use the Export button in the toolbar and choose CSV or JSON. The export uses your current filters, so whatever the table is showing — a single key, a date window, only errors — is exactly what downloads. CSV suits a spreadsheet; JSON suits a script or a data pipeline.
Common Questions
- Are my API keys exposed in the logs?
- Do Test and Live requests show up together?
- Who on my team can see the request logs?
- Does viewing my logs use any quota?
Are my API keys exposed in the logs?
No. Wherever a request URL or its parameters appear — in the table and in the row detail panel — the API key value is masked. You can read which key made a call by its name, copy the request as cURL, or screenshot the panel without revealing the secret itself.
Do Test and Live requests show up together?
No. The log follows the dashboard’s Test / Live mode toggle: in Test mode you see only Test-key requests, and in Live mode only Live-key requests. Flip the toggle to look at the other set. The log is also scoped to your current workspace, so only keys in that workspace appear.
Who on my team can see the request logs?
Everyone in the workspace can view the logs — owners, admins, members, and viewers all have read access. Viewers cannot create or change keys (see how to create, rename and revoke API keys), but they can still inspect what has been called.
Does viewing my logs use any quota?
No. The Logs page reads data the dashboard already stored; it does not call the News API, so browsing, filtering, charting, and exporting your logs never spend requests or credits from your quota.