
How to Debug Your API Requests
A step-by-step way to find why an APITube request fails: status, headers, Playground and logs

Written by Erick Horn
June 28, 2026
Updated July 6, 2026
How to debug your API requests
When an APITube News API request fails or returns something unexpected, debug it in four moves: read the HTTP status and the ERxxxx code in the error envelope, check the x- response headers for your account state, reproduce the call in the dashboard API Playground, and inspect the exact request in your API Logs. Most problems are visible at one of these steps without contacting support.
The key idea is to separate the three things that can be wrong: your request (a bad parameter), your key (auth, mode, restrictions), or your account state (out of credits, rate-limited). Each step below points at one of them.
Start with the HTTP status and error code
Every failed REST request returns the same JSON envelope: a top-level status of not_ok, a request_id, and an errors array. Read errors[0].code (an ERxxxx value) together with errors[0].message, and branch your handling on the HTTP status first. For a 400, the message names the exact parameter at fault — for example "is_paywall must be 0 or 1." — which is usually the whole fix. The full map of statuses and codes is in understanding API error codes and HTTP responses.
A quick way to see both at once with cURL is to print the status line and body:
curl -i -H "X-API-Key: api_live_YOUR_KEY" \
  "https://api.apitube.io/v1/news/everything?language.code=en&per_page=5"
Read the response headers
Even a successful response carries headers that explain your account state, so add -i (or -D -) to your cURL call to see them. The ones worth reading when debugging:
X-Request-ID— a unique id for the call, identical torequest_idin the error body. Quote it when you contact support so the exact request can be traced.x-apitube-mode—testorlive. This instantly confirms whether the key you sent is a Test key, which is the cause of many “the data looks wrong” reports.x-points-remainingandx-balance-remaining— plan credits and pay-as-you-go cents left, so you can see a402coming before it happens.x-subscription-plan— the plan the key resolves to, andx-budget-remainingwhen you have set a monthly pay-as-you-go limit.
Reproduce the call in the API Playground
The dashboard API Playground runs a real request for you: you pick one of your keys, fill in the endpoint and parameters, and it sends the call and shows the same JSON response your own code would get. Because it uses a real key, your quota, endpoint scopes and key restrictions apply exactly as they do in production — nothing is bypassed.
This isolates the bug. If the Playground returns what you expect but your own code does not, the difference is in how your code builds the request — usually the authentication header, the key mode, or a mistyped parameter — not in the API.
Inspect the request in your API Logs
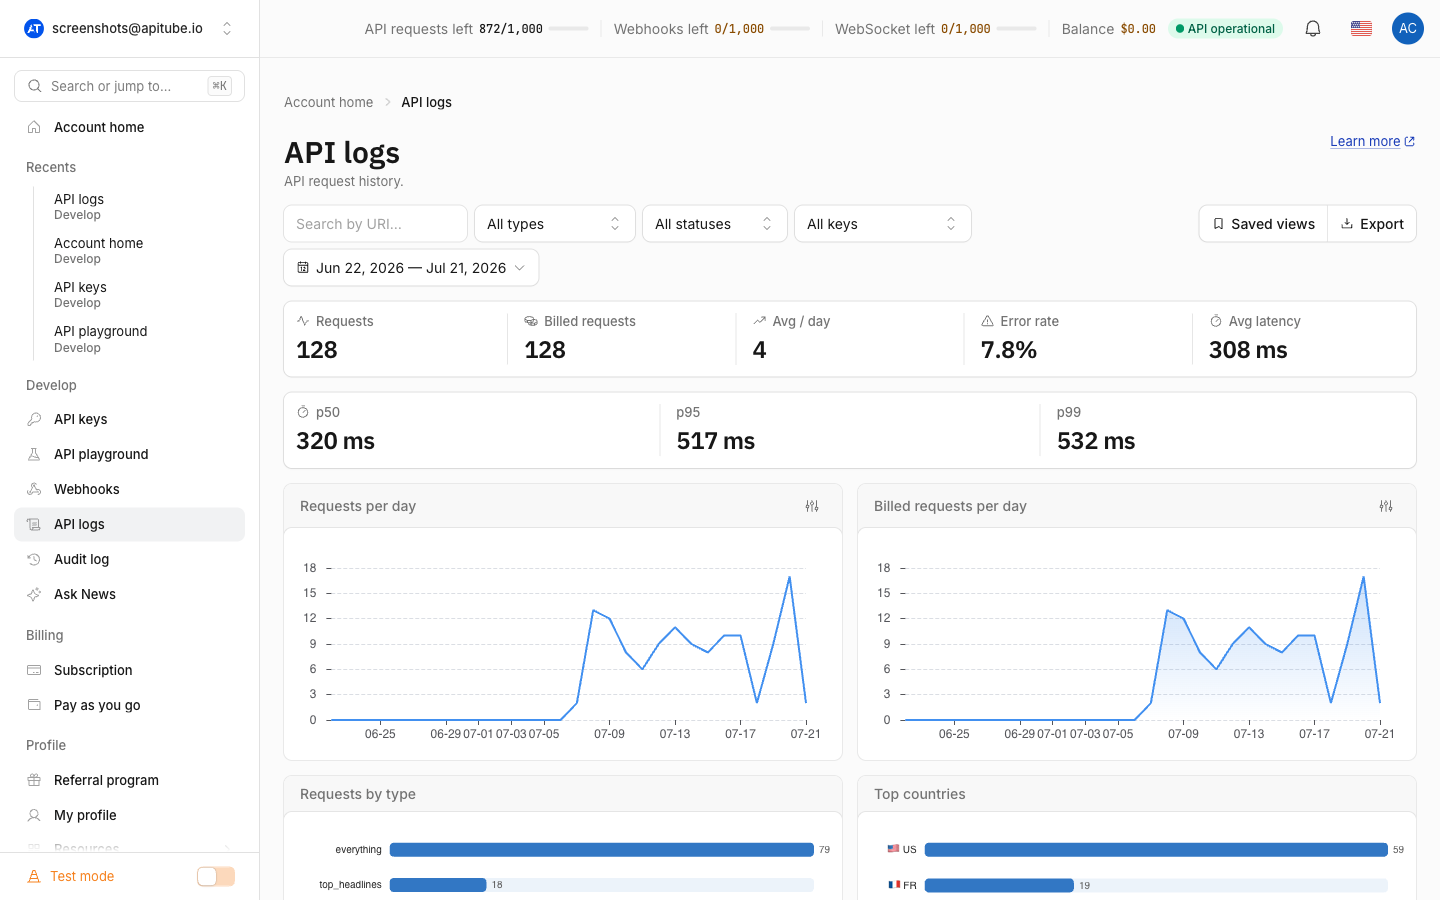
The dashboard API Logs page records every call your keys make, including failed and empty ones. Each row shows the Time, Type, Status, Latency, API key, Cost and Endpoint, and opening a row reveals the query parameters that were sent and the calling IP address. Filter Status to Errors, then narrow by key and date to find the failing call quickly.
Because the log captures the parameters and status the server actually saw, it is the source of truth for “what did my code really send?” — far more reliable than re-reading your own code.
Common gotchas to check first
Before deep debugging, rule out the frequent causes:
- Placeholder or masked text in the body → you are using a Test key, which truncates article content. See why results are masked or placeholder text.
401→ the key is missing, invalid or expired. See how to fix authentication (401) errors.403→ the key is blocked by an IP allow-list or endpoint scope. See why a request is blocked by IP or scope.429→ you passed your per-minute rate limit; wait and retry. See how to fix rate-limit (429) errors.- An empty result set with HTTP
200→ this is not an error; your filters are too narrow. See why a search returns no results.
Common Questions
- Why does the same request work in the Playground but not in my code?
- How do I send enough detail for support?
- Can I see the exact request my code sent?
Why does the same request work in the Playground but not in my code?
When the API Playground succeeds but your own request fails, the request itself is fine, so check how your client builds it. Confirm you send the key as the X-API-Key header (or the api_key query parameter), that it is a Live key if you expect full content — read the x-apitube-mode header to be sure — and that every parameter name matches exactly. URL-encoding of values like dates and quoted phrases is a common culprit.
How do I send enough detail for support?
Include the request_id (also returned as the X-Request-ID header), the full error envelope, the endpoint and HTTP method you called, and the timestamp. The request_id lets support trace the exact call, which resolves issues far faster than describing the symptom.
Can I see the exact request my code sent?
Yes. Open the failing call in the dashboard API Logs and expand it: the detail panel shows the query parameters the server received and the endpoint, alongside the status, latency and IP. Comparing that to what you intended to send usually reveals a missing or mistyped parameter immediately.